|
By J. Madeleine Nash |

To
Larry Edwards, a cave is a time machine.
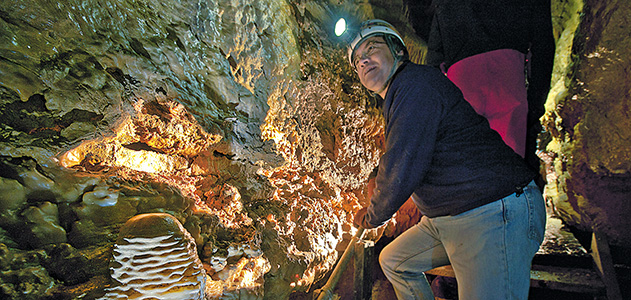
A honeycombed cave formed untold millennia ago beneath what is now southeastern Minnesota. Larry Edwards is standing in a subterranean chamber, his headlamp illuminating a series of mineral formations. From the cathedral-like ceiling dangle tubes known as soda straws. Along a waist-high ledge squats a trio of stout stalagmites, their surfaces slick with ecru-colored ooze. “Now that’s the kind of thing we might be interested in,” Edwards says, bending to peer at one.
I hear the plink, plink, plink of falling droplets. One hits the top of
a stalagmite, then spreads out, laying down a thin film of the mineral
calcium carbonate, or calcite, from rainwater seeping though limestone.
Drop by drop the stalagmite has grown to its present height—about 18 inches—over
who knows how many centuries.
Edwards, a geochemist at the University of Minnesota and a pioneer in
the use of cave formations to document ancient climate, is not planning
to collect stalagmites today. But two specimens severed from their moorings
when the owner of the cave complex, Spring Valley Caverns, opened a deeper
passageway recently provided Edwards and his colleagues with a record
of extreme rainfall events over the past 3,000 years. Edwards wonders
if some of Spring Valley’s stalagmites could contain older records still,
dating back to when giant glaciers covered much of the Northern Hemisphere
or even to one of the distant warm periods, or interglacials, that punctuated
the ice age world.
A short time later, we retrace our steps, navigating the sequence of walkways and ladders that leads to the cave’s entrance. As we step into the light, Edwards turns to me. “Do you notice all the sounds, all the smells?” he says. “When you come up, they seem so pronounced.” Edwards, renowned among paleoclimatologists for his cave findings, isn’t much of a spelunker. “It’s not that I’m claustrophobic,” he says with a shrug, “I just like it better up here.”
***
To Edwards, a stalagmite is more than a chunk of geology that looks like
a modern sculpture: It’s a collection of climate sensors, rather like
tree rings but extending often hundreds of thousands of years back in
time. Perhaps the only other earthly archives that have provided such
a high-resolution portrait of the past half-million years are ice cores.
But
unlike ice, caves can be found all over the world. “I would go so far
as to say that these are among the most important paleoclimate records
we have,” David Battisti, a University of Washington atmospheric scientist,
says of the cave data.
From
Edwards’ lab is emerging a high-resolution picture of precipitation patterns
long ago. Just as important, his work is providing the scientific community
with an increasingly precise time scale, one that is bringing other records
into alignment. Edwards and his colleagues have used cave formations to
tighten up the timing for ancient rises in carbon dioxide locked into
Antarctica’s ice. They’ve even used them to date skeletal remains that
trace human migration routes.
Why
should we care about what happened so long ago? A reason can be found
in the mounting nervousness over the consequences of global warming. With
heat-trapping carbon dioxide in the atmosphere already reaching levels
not seen for at least 800,000 years, scientists like Edwards worry that
weather patterns could undergo sudden, destabilizing changes.
Ice
cores from Greenland, for instance, reveal a sequence of abrupt temperature
oscillations over the past 140,000 years, with severe cold snaps leavened
by a series of sudden, if ephemeral, warmings. Eerily similar oscillations
are now showing up in the precipitation records from caves. In a landmark
study, Edwards
and his collaborators compared the precipitation swings captured by Hulu
Cave on the outskirts of Nanjing, China, with temperatures encoded by
Greenland’s ice. Plotted as graphs, and positioned side by side, the dips
and valleys in both records are sharp and—for the 60,000-year period covered
by the stalagmites—synchronous.
Edwards and his colleagues have data from other Chinese caves showing that East Asia and the North Atlantic have probably been dancing together climatically for more than 380,000 years. They swirled and twirled through the last ice age, and the ice age before that, and the one before that, and the one before that. When Greenland and the North Atlantic shiver, the monsoon in China weakens, Edwards says, and when the North Atlantic region warms, the monsoon switches into higher gear.
This teleconnection, as scientists call the long-distance linkage, appears
to be an enduring feature of the climate system, persisting well into
the interglacial epoch in which we are living. Known as the Holocene,
this time period began 11,700 years ago as the great ice sheets underwent
terminal collapse. An example Edwards likes to cite comes from a stalagmite
found in Wanxiang Cave in China’s Gansu Province. Little more than four-and-a-half
inches long, it spans a period of 1,810 years, starting in A.D. 190. Among
the events chronicled in its ledgers, Edwards and his colleagues have
found, are an early 11th-century wet interval that rings in the golden
age of the Northern Song dynasty and a grinding drought that, six centuries
later, rings out the Ming.
The rise of the Song, Edwards observes, coincides with the so-called Medieval
Warm Period in Europe; the decline of the Ming, with the Little Ice Age
that followed. “When the Ming collapsed, the Thames was freezing over
in wintertime,” Edwards says. “And when rice cultivation was expanding
in China, the Vikings were building houses in southern Greenland.” Wanxiang
Cave, in other words, provides a context for events chronicled in historical
records, bolstering confidence in cave formations as accurate recorders
of climate prehistory.
Edwards is struck by the fact that Wanxiang Cave has registered a recent
breakdown in the East-West teleconnection, reinforcing the data from weather
stations: Rather than growing wetter as one might expect, China is turning
drier as northern Europe warms. “Here we have this dance that’s gone on
for hundreds of thousands of years, and then, suddenly, midway through
the 20th century, we find the two partners going in opposite directions.”
In this case, he and others speculate, greenhouse-gas-driven warming does
not appear to be the culprit. Instead, they say that rising concentrations
of black carbon—soot—or other kinds of dust may have changed precipitation
patterns across Asia.
***
I catch up with Edwards in the campus laboratory where he plies his trade.
Not quite six feet tall, with a solid frame and expressive face, he carries
just a hint around the eyes of his Eurasian heritage. Were it not for
the gray in his hair, the 59-year-old scientist might pass for one of
his graduate students. He grew up in an academic family in Ann Arbor:
his father, Richard, was a historian of Oriental art at the University
of Michigan, and his mother, Vee Ling, born in southeastern China, was
an artist and university lecturer in Chinese. Edwards went to MIT, studying
geology, art and architecture, and after a stint as a naturalist in northern
Minnesota’s Voyageurs National Park, he earned his PhD in geochemistry
at the California Institute of Technology. When he arrived at the University
of Minnesota, in 1988, he was best known for his work on ancient corals
as markers of sea-level rise. Stalagmites popped up on his radar in the
mid-1990s when he took on a spelunking graduate student.
| Part of Edwards’ success lies in his knack for picking questions that cave formations are superbly suited to answer. The other part rests on his willingness to make incremental improvements in every step of a tedious process. First, he says, each stalagmite specimen must be sawn in two, its interior polished and examined under a microscope. In some cases, it’s possible to resolve annual growth bands, though often these are discontinuous, making them only proximate guides to the passage of time. The next step involves taking pinprick samples with a dental drill and subjecting them to analysis. Shifts in precipitation leave a subtle chemical signature in the calcite. The signature takes the form of a shifting ratio between two isotopes, or atomic forms, of oxygen that were present in the raindrops that made their way into the cave. | 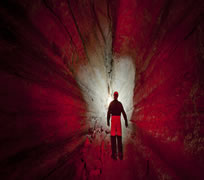 John Ackerman in Spring Valley Caverns |
A stalagmite’s layers also contain traces of radioactive elements, used to measure time: The isotope uranium-234 is soluble in water whereas its decay product, thorium-230, is not. As rainwater seeps through overlying soil and rock, it picks up uranium but virtually no thorium. In the layers of a stalagmite, then, thorium ever so gradually builds up, and at a predictable rate. You can think of the uranium as the sand grains in the top of an hourglass; the thorium, as the grains that fall through to the bottom. If a layer of calcite starts out with a million uranium atoms, just three will decay to thorium each year. Edwards excels at counting these atomic “sand grains” with a mass spectrometer.
The scope of the work becomes apparent in the lab’s basement storeroom.
All around us, lined up on shelves, are plastic boxes filled with stalagmites
from China, India, Brazil, Spain and Turkey, as well as the U.S. “There’s
the Amazon,” Edwards says, pointing to a row of boxes high above his head.
“You’ve got to see the Amazon. And there’s Sanbao,” from central China.
With some effort—“Whoa, I need a stronger back! That’s probably 40 pounds!”—Edwards
wrestles Sanbao to a table and extracts a length of cream-and-tan calcite
as smooth and shiny as marble. “Is that beautiful or what!” he says. High
on Edwards’ to-do list is finding many more records that, like Sanbao’s,
reach far into past interglacials, the balmy interludes most analogous
to our own. “It’s not that the past offers an exact road map to what the
future holds,” he muses. “But it gives us a natural baseline. We can then
ask, ‘What was climate like before we started changing things?’”
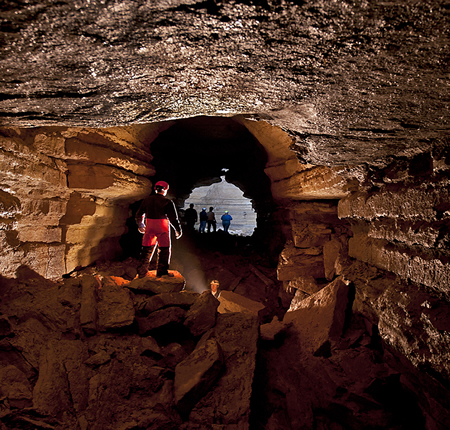
John Ackerman discovered this section of Spring Valley Caverns